Runaway Project
We are a nonprofit organization using AI and data science to shine a light on the forgotten histories and illuminating figures of the past that resisted oppression and racial injustice.
We are currently focused on the collection, dissemination and study of digitized fugitive ads. These ads offer rare insights into the experiences of the enslaved and are for many freedom runners the only record of their existence. So far our project has collected over 55,000 of these ads.
Map
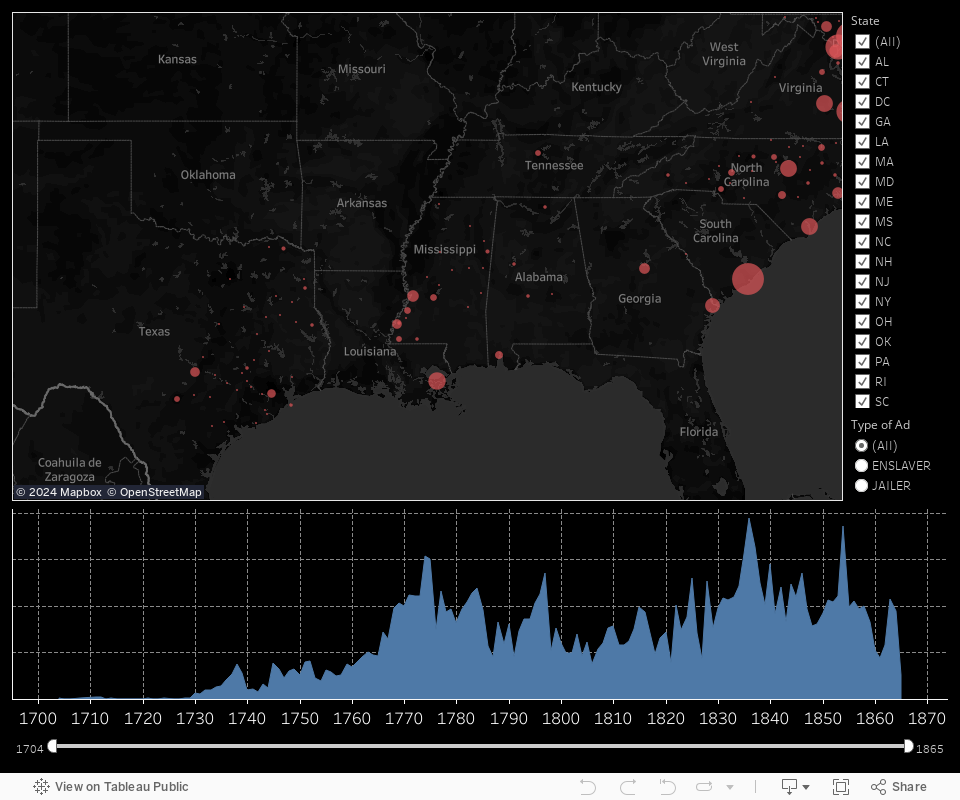
Each red dot represents a group of runaway events. A dot’s location corresponds to the first newspaper that published a record of the event.
Charts
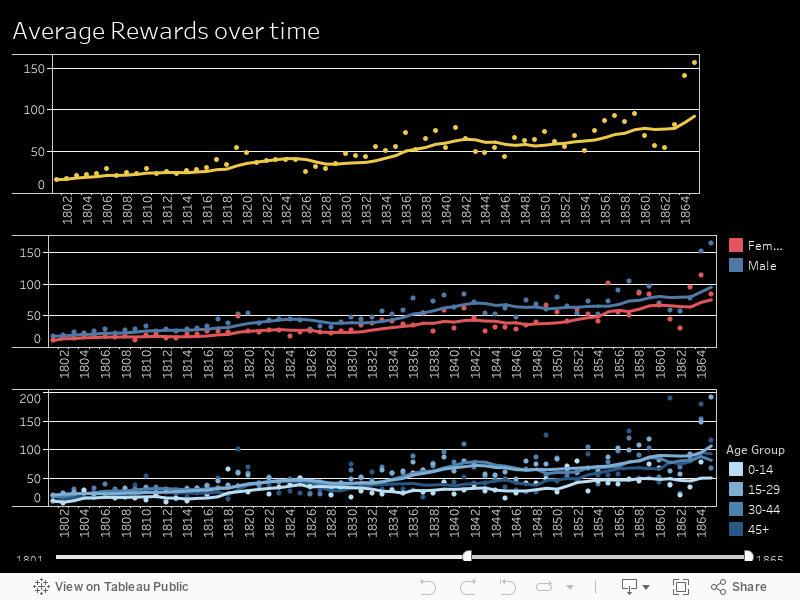
Rewards offered for runaways align closely to their relative value at auction. Differences in rewards offered for different age groups and genders are consistent over time.
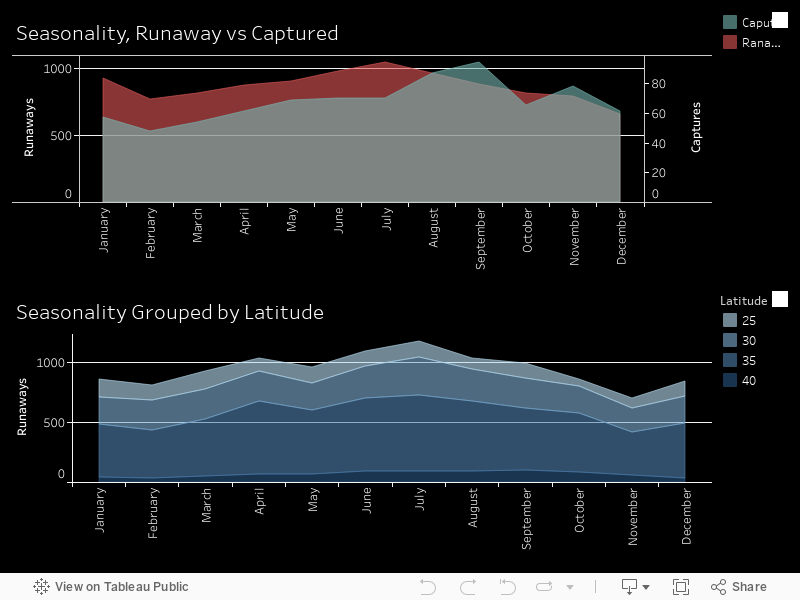
Time of year played an important role in a runaways decision about when to leave. Seasonal capture events lag runaway events. Different seasonal peaks emerge at different latitudes corresponding to differences in the harvest.